From your first question to your next improvement with Amami
We will walk with you from installing Amami MCP and adding tracking to checking real data, finding what changed, and choosing what to improve next.
You have shipped a website. Maybe it is a landing page, a small product, a docs site, or something you built with an AI coding assistant. The page is live, but the questions are only starting:
- Are people reaching the pages that matter?
- Where are they coming from?
- What do they do after they arrive?
- What should you improve next?
We built Amami for this part of the work.
Amami brings your website analytics into the same workflow where you build. You authorize the data you want to use, connect Amami MCP to your AI coding assistant, and ask questions in plain language. When you need to add tracking, your assistant can help you create the website connection, place the tracking script in your app, and check whether data is arriving.
This guide takes you through the whole journey with us:
- we will connect Amami MCP;
- we will add pageview tracking to your website;
- we will add events for the actions you care about;
- we will check that the tracking really works;
- we will ask Amami what is changing in your traffic;
- we will use what we learn to choose one clear improvement.
You do not need to become an analytics specialist before you begin. You only need a website, a question worth answering, and permission to change its code or site-wide custom code.
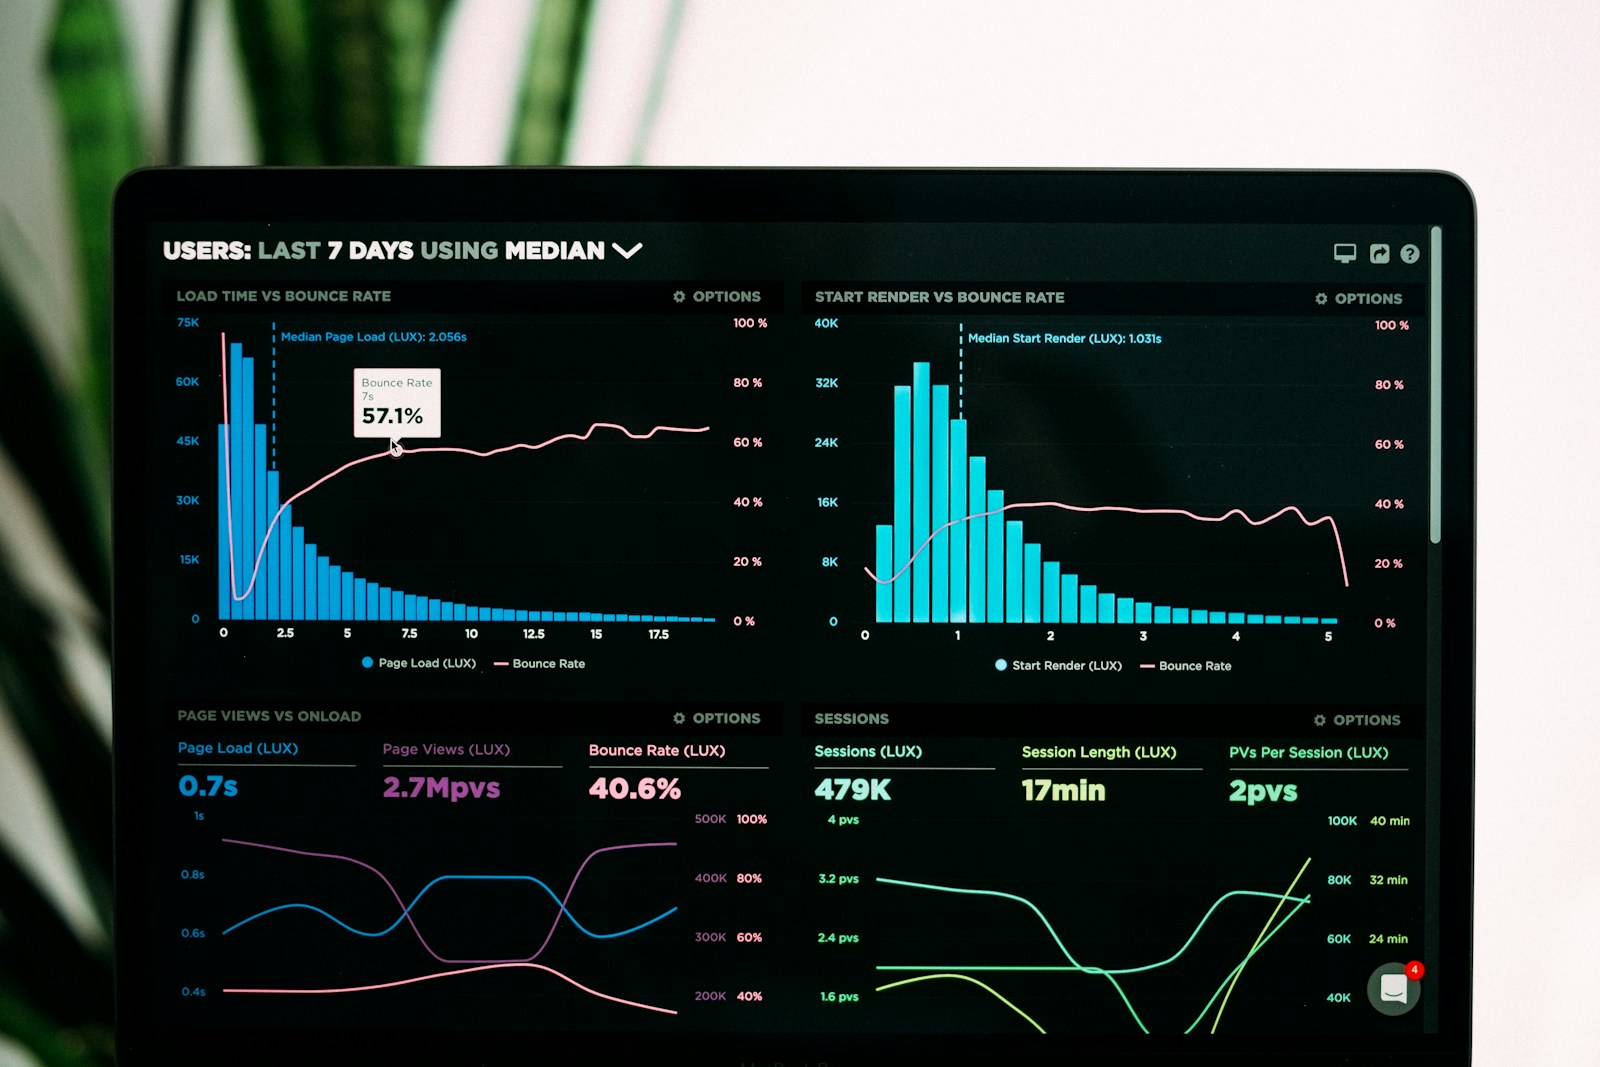
What you can use Amami for
Think of Amami as a way to bring your website data closer to the decisions you are already making.
You can use it to:
- connect a new website to your authorized Amami account;
- retrieve the tracking script for a website you already created;
- add pageview tracking to your shared HTML or application layout;
- add events for actions such as signup clicks, form submissions, or activation steps;
- check whether your website, pageviews, and events are visible in Amami;
- ask about visitors, pageviews, sessions, bounce rate, visit duration, top pages, referrers, UTM campaigns, devices, countries, and realtime visitors;
- compare one period with another or look at a specific segment;
- use funnel, retention, journey, attribution, UTM, revenue, or performance reports when you have the required data configured;
- ask your AI coding assistant to explain what changed and suggest what to look at next.
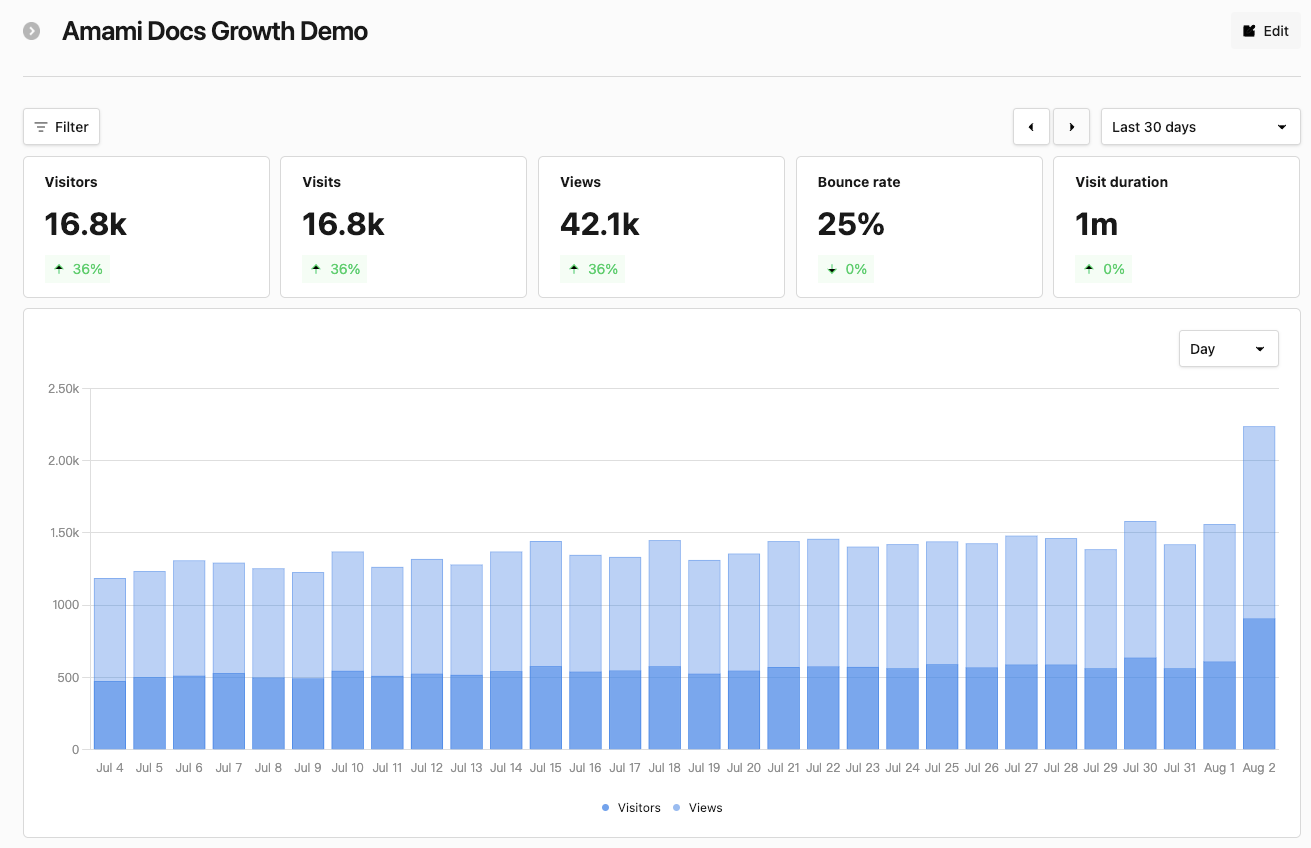
The Overview gives us the first shared picture: how many people arrived, how often they returned, how many pages they viewed, and whether the trend is moving. We can use that view to decide which question deserves a closer look.
We do not want to pretend that one tool replaces every analytics workflow. Your dashboard is still the right place to inspect charts, configure a website, share a view, or explore a report visually. Amami helps when you have a question and want to find the relevant evidence without leaving the place where you are building.
The loop we want to help you build
The most useful part of Amami is not one impressive answer. It is the loop you can repeat after every release, content change, or campaign:
- Connect: authorize Amami and choose the website you want to understand.
- Instrument: add the pageviews and events that describe what matters.
- Check: confirm that the script, pageview, and important events are visible.
- Ask: give Amami a website, a time range, a comparison, and a decision you are considering.
- Understand: look at the evidence and open the dashboard when a visual check will help.
- Change: make one product, content, or acquisition change.
- Measure again: compare the same signals and decide what you learned.
Let's walk through that loop together.
Before we begin
You do not need to understand code or analytics before you start. You only need a website, an Amami account, and access to the place where you edit that website.
If you are not sure where that place is, that is okay. Your AI assistant can help you find it.
1. Let's install Amami together
Copy this into your AI assistant: Codex, Cursor, or Claude Code.
Read and follow the canonical Amami MCP and Skills installation guide at https://analytics.amami.dev/install/mcp-install.md. Use this guide as the only setup source. Do not use web search or another installation guide.The link in that message is the installation document written for your AI assistant. It will read the document, install Amami, and make it ready to use. You do not need to understand the commands or set up anything by hand.
If your assistant opens a browser, sign in and approve access there when it asks. Keep your password and API key out of chat. When installation is complete, move straight to the next step.
The browser handoff is the one part where you need to click. You should see a simple authorization page like this:
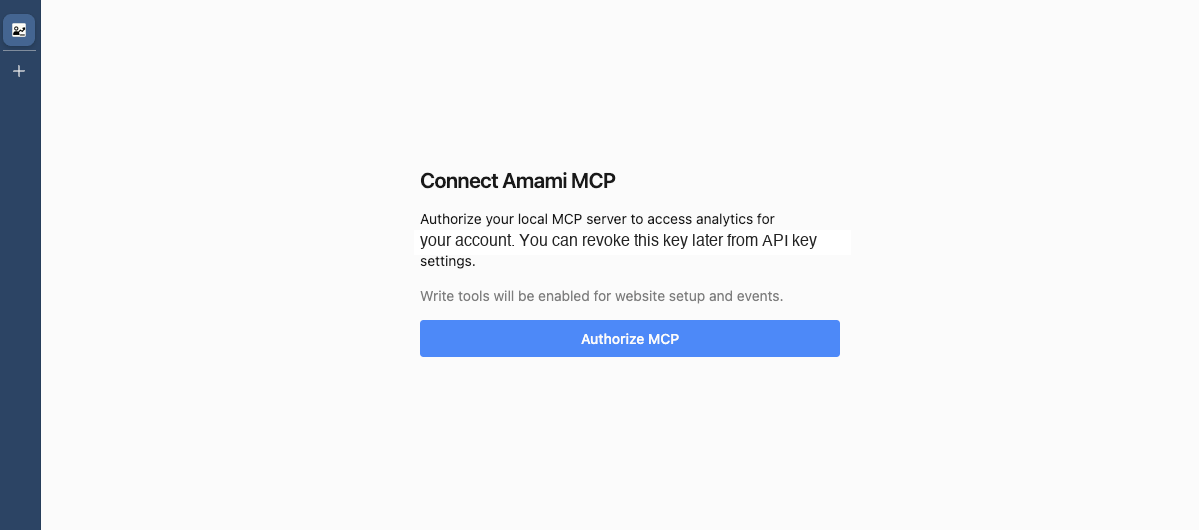
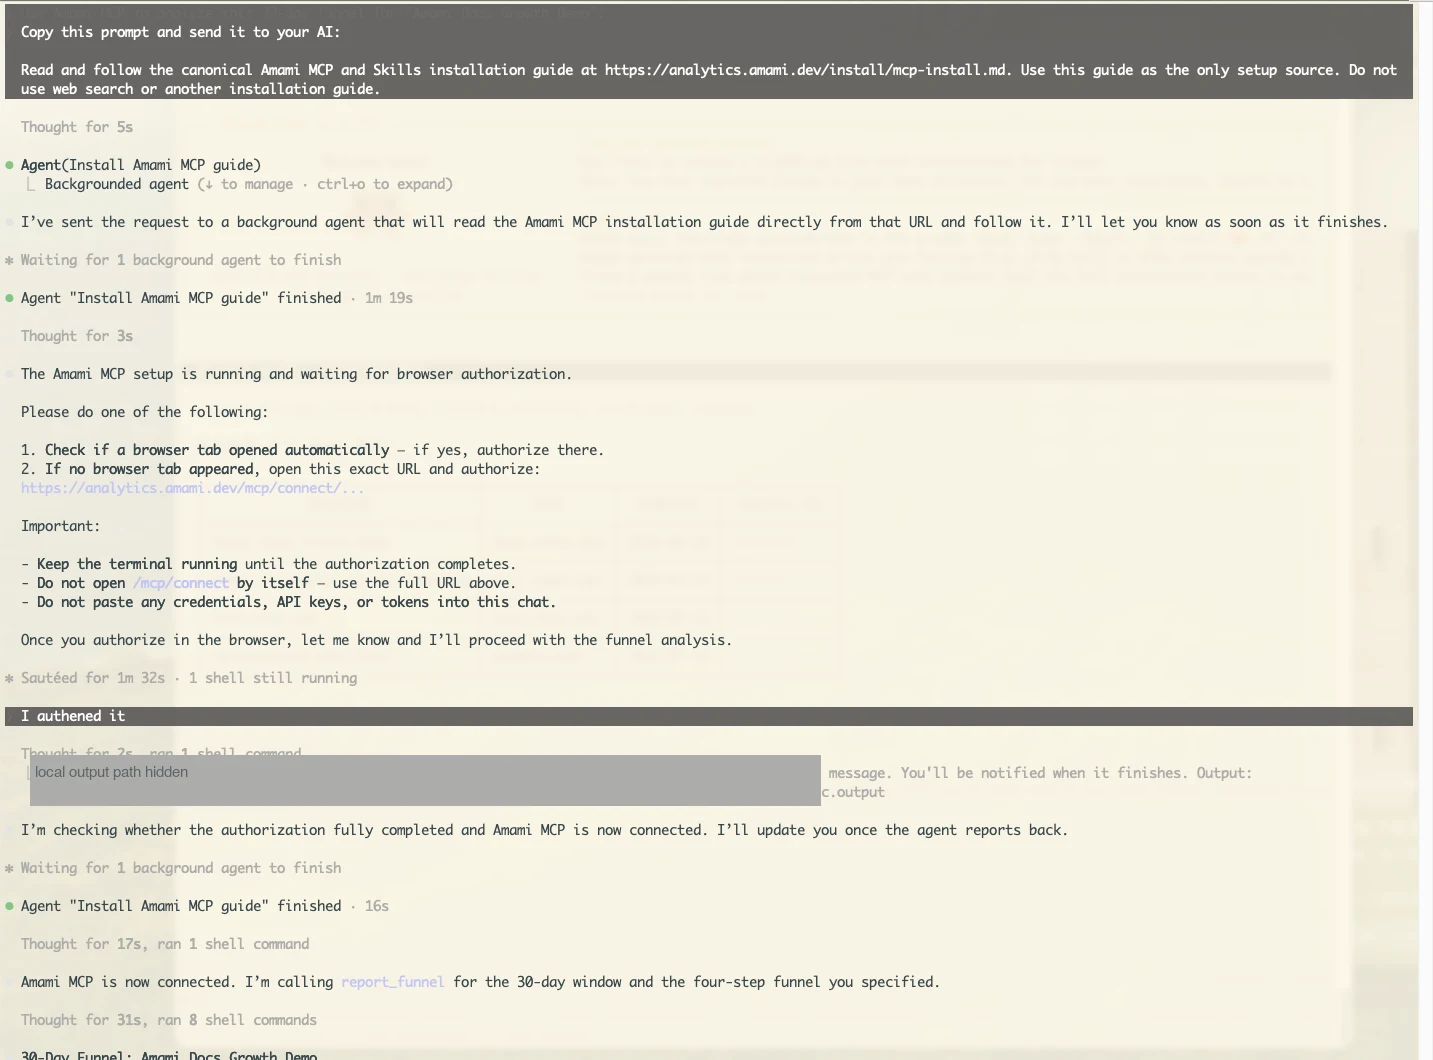
After you click Authorize MCP, leave Claude Code running until it confirms that the connection is ready. The assistant can then continue with the analytics request in the same conversation:
2. Let's add your website tracking
After your assistant finishes the installation, open the project or website editor where your website is managed. Then copy this sentence to your assistant:
Please add the Amami tracking script to this website so every page is tracked. Find the correct place, complete the change for me, and tell me how to check that it is working.You do not need to know whether the script belongs in a layout, a template, or a settings page. If your website uses a website builder, open its custom-code area and send the same sentence. If you cannot find it, ask the assistant where to open.
Use the tracking script Amami gives you. Do not copy one from another website or change it by hand.
3. Let's track the actions that matter
Pageviews tell us what people read. Events tell us what they tried to do.
You do not need to track every click. Start with the actions that represent progress toward the outcome you care about:
- someone clicks Sign up or Start;
- someone copies your install prompt;
- someone submits a form;
- someone connects a website;
- someone completes the first successful query;
- someone clicks a pricing or upgrade CTA;
- someone completes an activation step;
- someone starts checkout or upgrades.
You do not need to name or create these events yourself. Ask your assistant:
Please add tracking for the most important actions on this website: signing up, submitting a form, clicking Start, and finishing setup. Ask me before adding anything else, and do not collect personal information.Start with one or two actions that matter most. Your assistant can choose clear names and add the tracking without asking you to edit code.
4. Let's make sure the data is really arriving
A tracking script in your website is a good start, but it is not proof that data is arriving. We will check it together in simple steps.
First, check the website visit
Open your website in a browser, then ask:
I just opened the website. Please check whether Amami recorded this visit. Tell me only whether tracking works, and tell me the simplest next step if it does not.If you just added a new action, check that action the same way:
I just completed [describe the action in a few words]. Please check whether Amami recorded it. If it did not, tell me the simplest next step.You are looking for a simple yes or no:
- Amami is connected;
- the tracking script is on the website;
- a recent visit appears;
- an important action appears when you complete it;
- no personal information is being collected.
If something is missing, use the Tracking and events troubleshooting guide or ask your assistant to explain the next step in simple words.
5. Now let's ask what is changing
Once visits and important actions are arriving, you can ask Amami questions from the same place where you are building. The more context you give us, the more useful the answer will be.
The dashboard remains useful here because it gives us a visual place to inspect the answer. Your assistant can bring the relevant data into the conversation; you can open the matching view when you want to see the page list, source breakdown, or live activity for yourself.
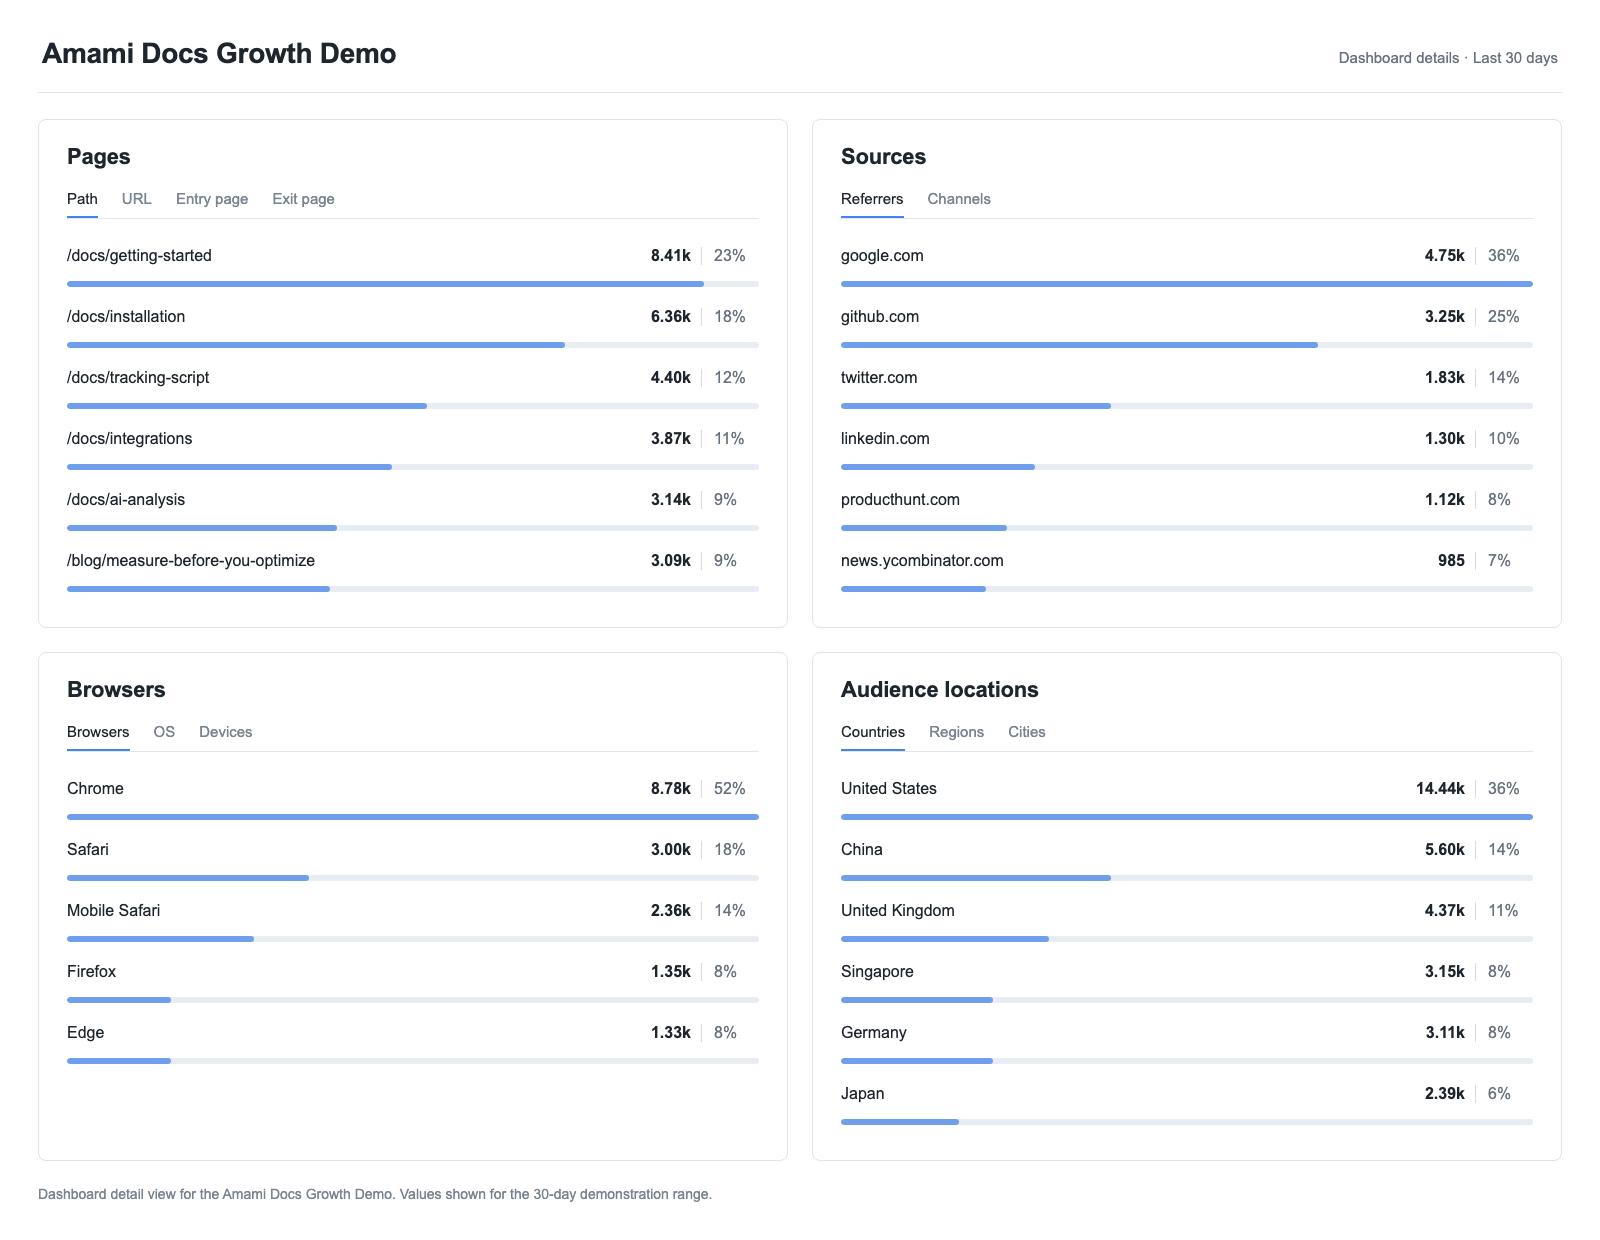
This detail view helps us move from a broad question to a useful one. We can see that the getting-started and installation pages lead the page list, Google and GitHub account for most attributed referrals, and Chrome is the largest browser group. Those differences give us something specific to investigate instead of a vague feeling that “traffic looks okay.”
Instead of asking:
How is my site doing?Try this:
Please look at this website's last 14 days. Tell me how many people visited, which pages they viewed most, where they came from, and the one thing I should investigate first. Use only real Amami data and say when data is missing.Claude Code can turn that question into a compact report by combining the headline metrics with pages, sources, browsers, and countries:
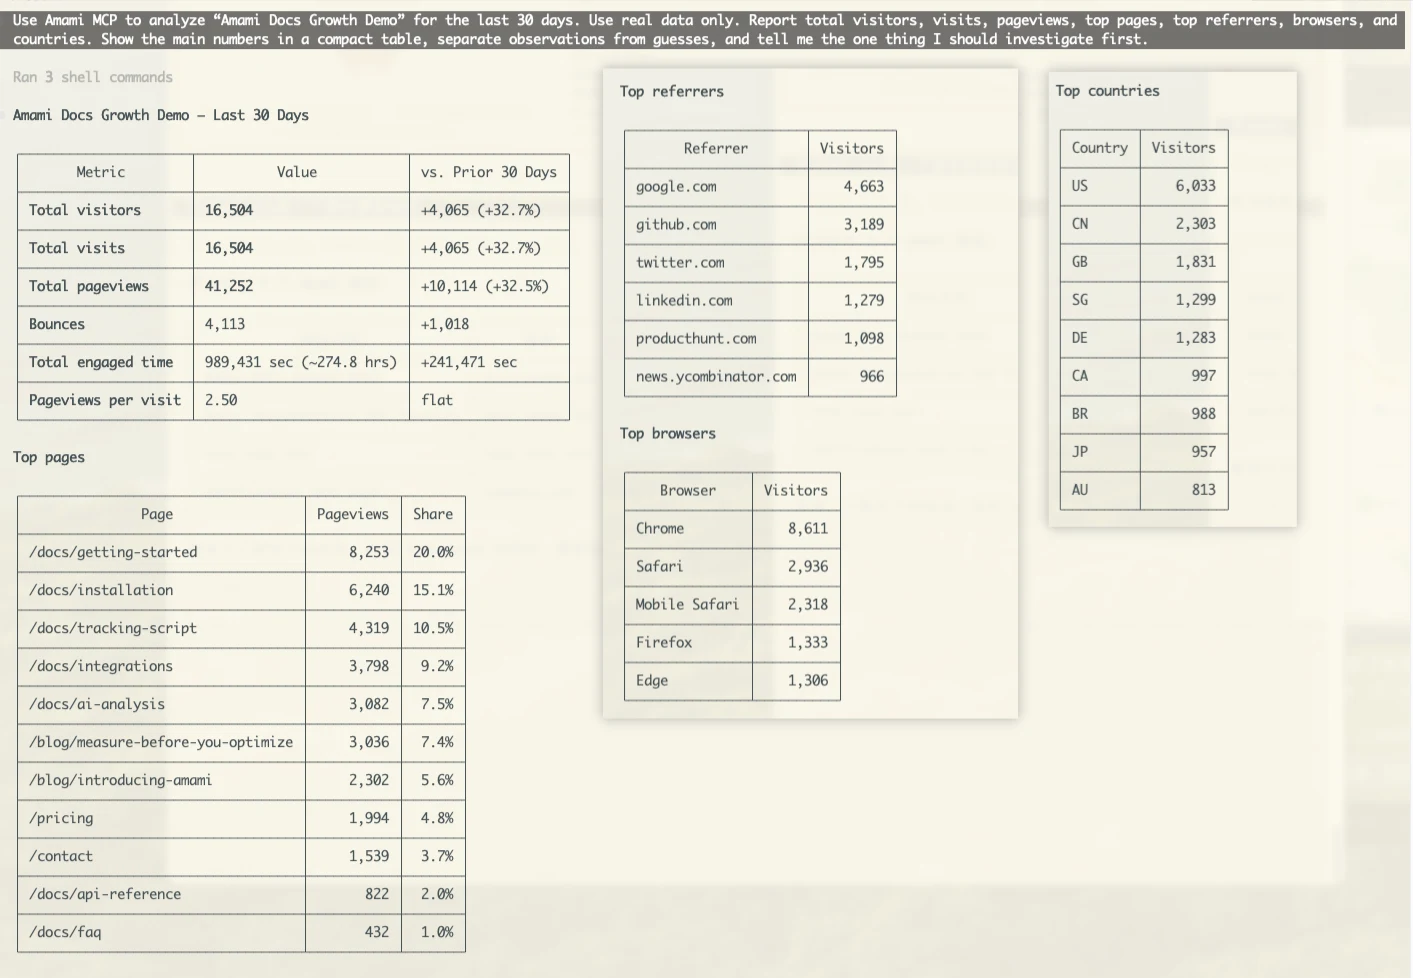
For the demo site, this is the useful distinction: the numbers are real records from this Amami website, but they are demonstration data, not customer growth. The answer is valuable because it tells us what to inspect next and makes its evidence visible.
Here are a few questions you can copy and adapt:
Which pages did people visit most in the last 30 days, and what do they have in common?Where did the people who clicked the signup button come from? Please compare the main sources and explain the result simply.Please look at the signup journey on phones and computers. Where do people stop, and what should I check before changing the page?People are visiting the website right now. Please tell me which pages they are viewing and where they came from. Separate what you can see from what you are guessing.You do not need to know which report or tool to use. Amami will choose the right data for the question. You can still ask it to show its work:
Please answer using only real Amami data. Tell me what you looked at, what you know, what is missing, and one next step.When we ask for the next investigation instead of a generic summary, Claude Code can turn the report into a focused question about a specific source and conversion path:
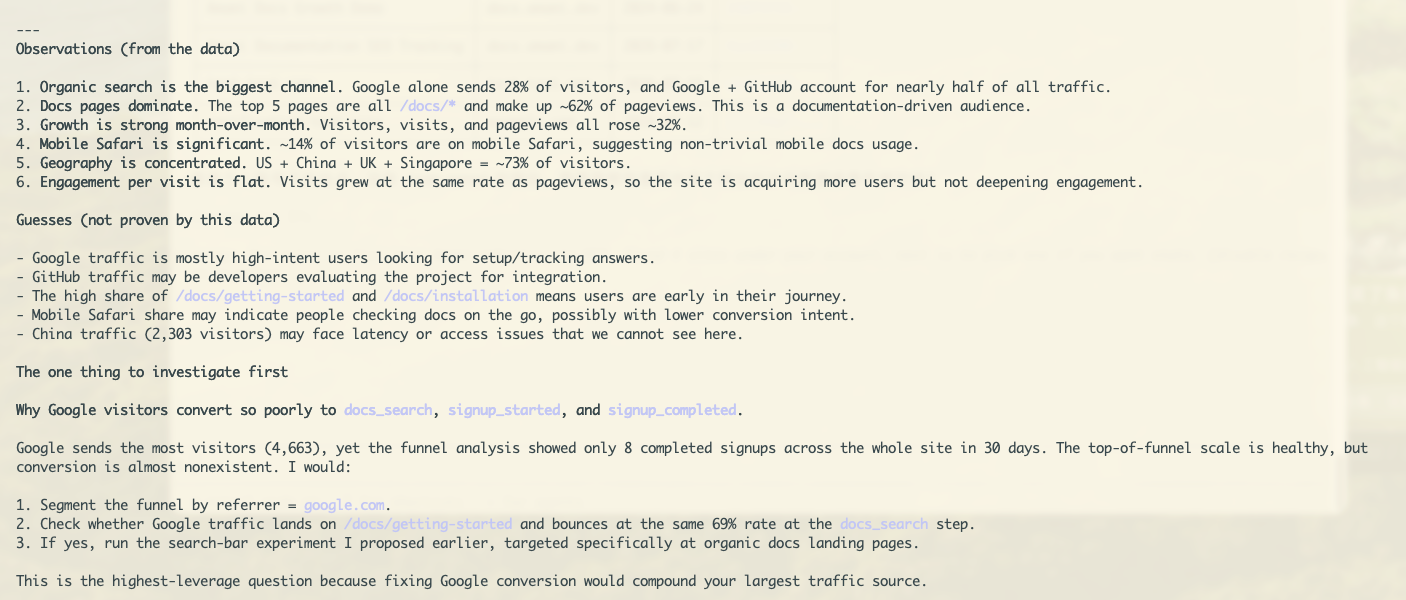
If we do not have the event or segment needed to answer a question, the honest answer is that the data is missing. We should add the right instrumentation instead of inferring a conversion result from pageviews alone.
For more prompt ideas, see natural-language analytics queries.
6. Let's turn the answer into an improvement
This is where analytics starts helping your product instead of becoming another report you forget to open.
The report is not the finish line. We use it to choose the next question worth acting on.

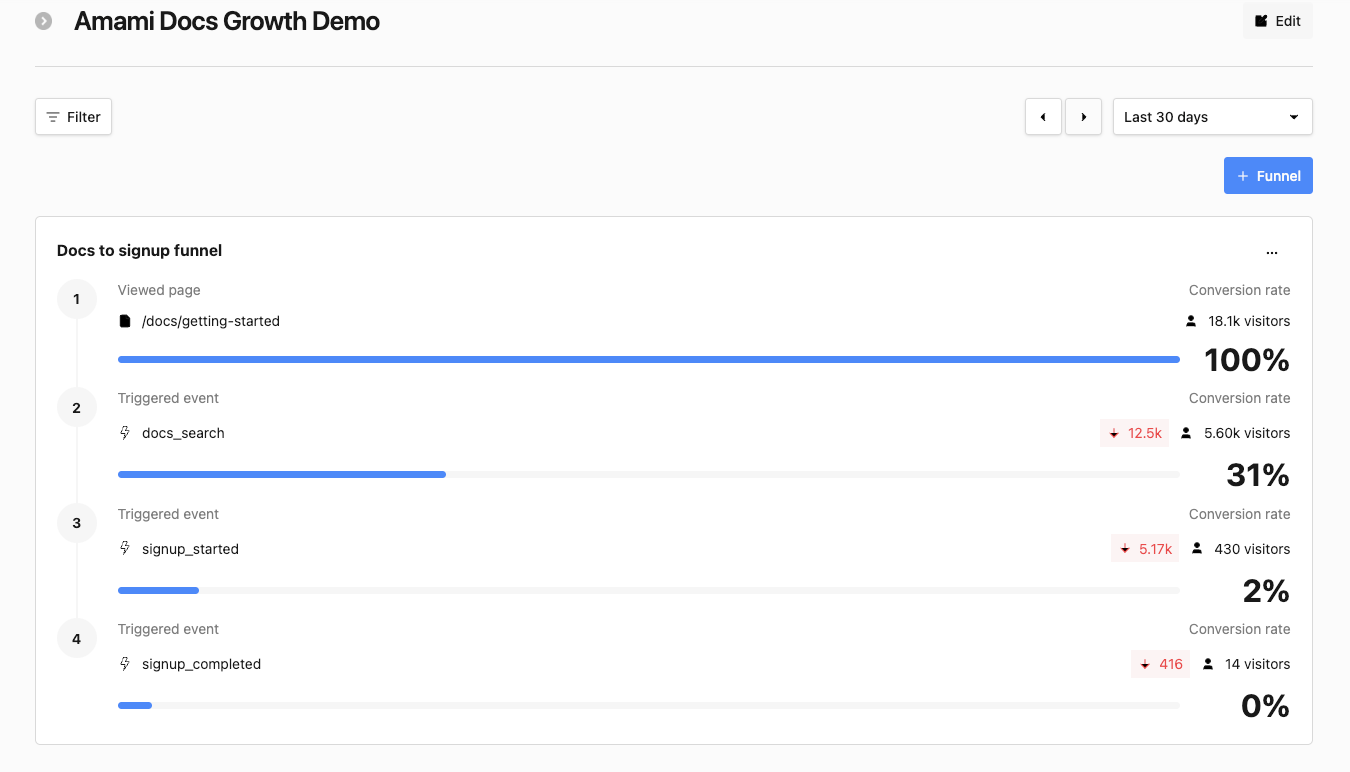
The funnel makes the decision concrete: it shows where people continue and where they stop. In this example, the large drop between searching the docs and starting signup gives us a clear place to form a hypothesis and test one change.
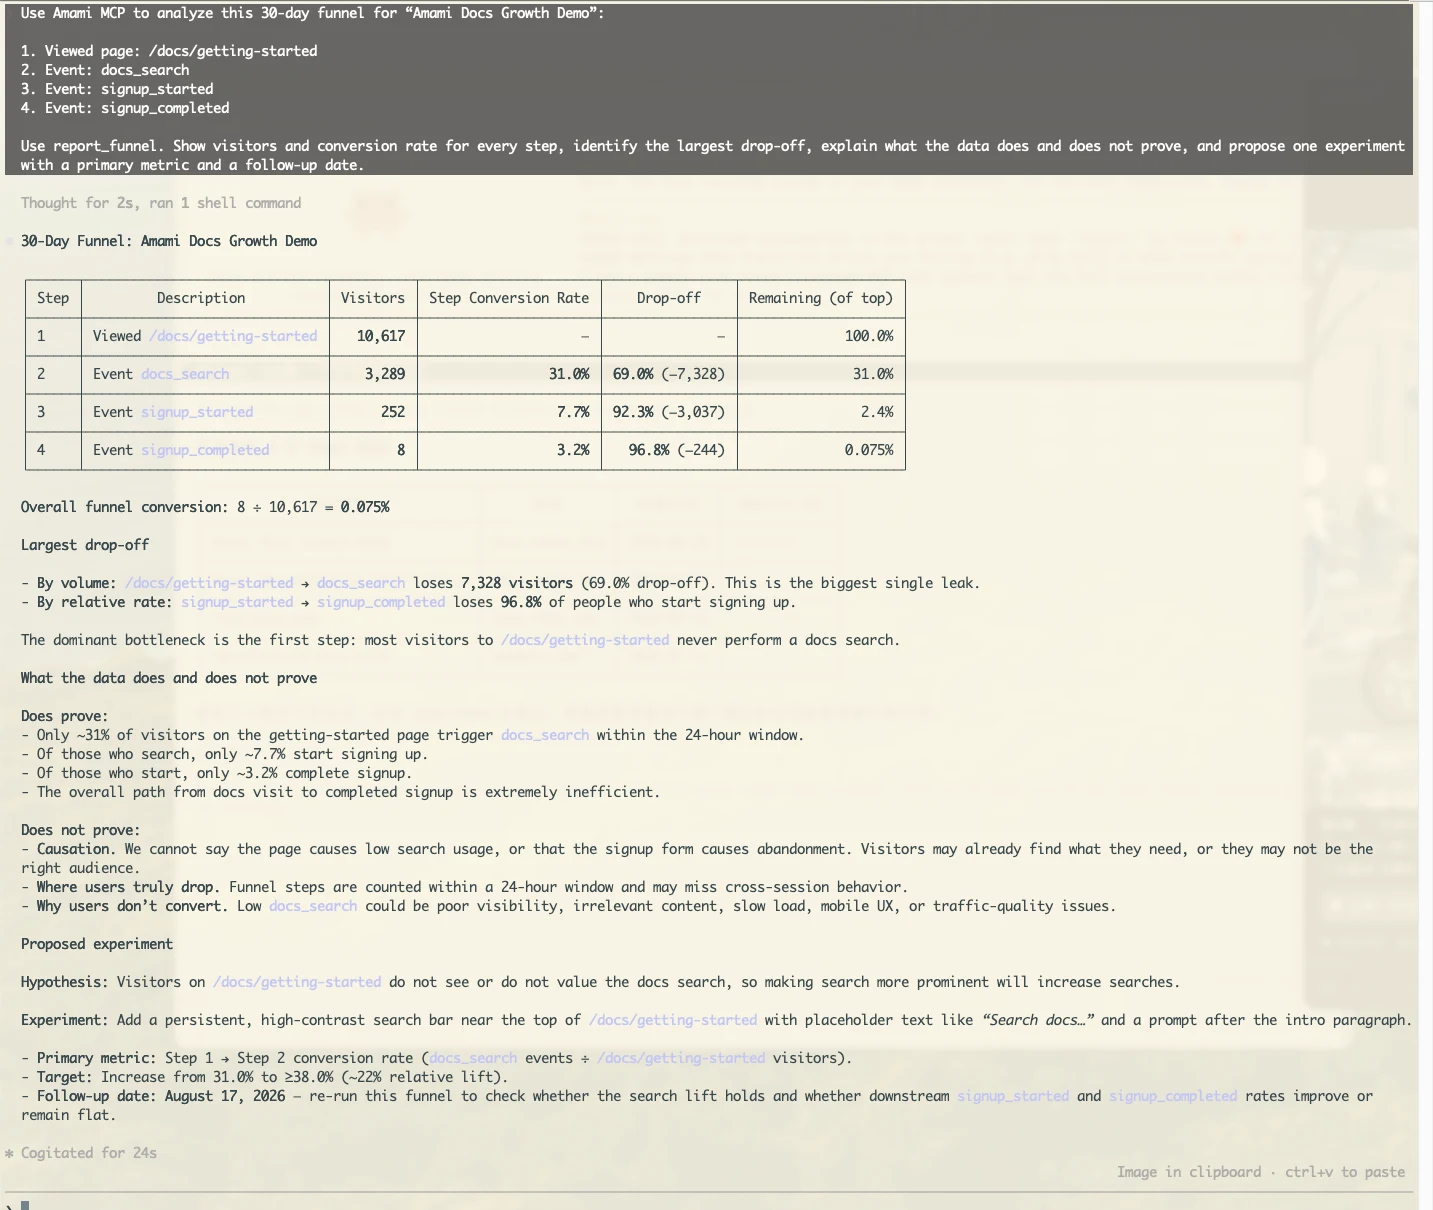
Claude Code can bring the same funnel into the conversation, explain what the numbers prove and do not prove, and propose a measurable experiment:
Start with a question you can act on
Let's say you notice that many people read your docs, but few click through to setup. Turn that observation into a hypothesis:
If we make the setup CTA clearer on the documentation pages, more qualified visitors will start the setup flow.
Now the question has a page, an audience, an action, and an expected direction. That gives the next analysis a purpose.
Choose one primary signal
Pick one event or conversion action that represents the outcome. Supporting signals can help us explain what happened, but do not make five metrics equally important.
For the setup example, make the signup button click the main thing we watch. Pageviews, device, and traffic source can help explain the result, but we do not need to track everything at once.
Make one change
Change one thing: the CTA copy, the layout, the flow, the page speed, or the campaign link. Keep the event names stable unless the action itself changes. If you do change an event definition, record it so we know why the comparison may have moved.
Ask for a before-and-after read
After the new version has had enough traffic, ask:
Please compare the period before and after I changed the signup button. Tell me whether more people clicked it, which phones or computers changed, how much data you used, and whether we should keep the change or wait for more data.Decide what to do next
The answer should help us choose one of three next steps:
- keep the change and continue monitoring;
- revise the change and run another measured test;
- revert the change because the evidence moved in the wrong direction or the signal was not trustworthy.
One spike is not proof. Before we make a larger product or marketing decision, let's check the date range, baseline, sample size, event definition, and traffic mix.
A small routine you can keep using
Once everything is connected, your routine can stay simple:
- After you publish a change: ask what happened to visits and your main action.
- During a launch: ask who is visiting, which pages they are viewing, and where they came from.
- Each week: ask which page or step deserves your attention first.
- After a content change: compare the changed page and the action you want people to take.
- Before trying something new: ask the assistant to check that the right action is being measured.
When you write down a decision, keep four things together: the time range, the website, what the data showed, and what we will check next.
A note about permissions
You stay in control at every step:
- sign in and approve access in the browser when your assistant asks;
- never paste your password or API key into chat;
- let the assistant explain a change before it makes one;
- when data is missing, the assistant should say so instead of inventing an answer.
We help you find and understand the evidence; you decide what to authorize and what to change.
What we hope this feels like
We do not want your experience to be “an AI writes a confident analytics paragraph.” We want it to feel more practical:
- you ship a page, feature, or campaign;
- Amami collects the visits and important actions you chose to measure;
- you ask your assistant what changed;
- your assistant brings back the relevant evidence from your website;
- you look at the result and decide what to change;
- the next release is measured against the same signals.
That is the role Amami is meant to play in your optimization process. It keeps analytics close to the place where you build, while keeping the data, permissions, and final decisions clear.
Start with one website, one important action, and one question that has a real decision behind it. We will help you take it from there.
For the setup details, see the Amami Quickstart, Tracking and events, and natural-language analytics queries.